Stock portfolio tracker
Track stocks, mutual funds, and ETFs in a simple portfolio.
Stock tracking tools
Follow your daily and overall portfolio performance. Additionally, the total portfolio value and cost are always displayed at the top. The last one is the total sum of paid out dividends in the portfolio.
Track individual buy and sell transactions. You can enter shares, commissions, and notes for each of the portfolio lots. You can also edit or remove individual transactions.
Portfolio performance charts help you track the portfolio value and daily performance. Choose between different time frames and see portfolio details when you hover over the charts.
Dividend payouts are recorded automatically. Paid out dividends are added to the total cash balance of the portfolio and are visible as one of the portfolio summary metrics at the top. Portfolio transactions are also automatically adjusted for splits.
Track cash by adding cash deposits and withdrawals to your portfolio. You can set any stock transaction to be cash-linked which will reflect on the total cash balance.
Set up price alerts for the stocks in your portfolios. You can receive them as email or push notifications and set up different price limits for the same portfolio.
Get a quick view of your portfolio performance and sector breakdown by accessing a heat map view of the portfolio. The colored visualization makes it easy to understand different aspects of the portfolio.
Monitor your stocks as a simple watchlist compared to a portfolio. If you don't input any transaction information, the portfolio becomes a watchlist and the return is calculated based on a theoretical investment.
Track additional information such as most recent news and insiders trading. Open the portfolio in a screener view to access advanced technical and fundamental metrics of the portfolio holdings.
Import your portfolio from a CSV or OFX file. Export summaries and transactions into a spreadsheet for better accessibility and management. You can also export any of portfolio chart as an image or a PDF file.
You can add any stocks listed on Nasdaq, NYSE, and NYSE MKT to the portfolio. Additionally, ETFs and mutual funds can be added to the same portfolios. Portfolio tracking for Canadian, European, and international stocks will be available soon.
Monitor your dividend reinvestments by automatically recording dividend reinvestments transactions in your portfolio.
Mobile stock tracking
Access your portfolios and watchlists on the go. If you're looking for a stock tracker app, simply use the portfolio tracking on your phone or tablet with the same tools and features as on your desktop.
Notifications
Receive price alerts for the stocks in your portfolios
News
Recent stock news are part of the stock portfolio to help you keep track of the markets
Advanced charts
Watch and interact with the advanced technical indicators
Heat maps
Explore the performance of all market sectors and industries
Insiders trading
One-click access to the most recent SEC Form 4 filings in your screen
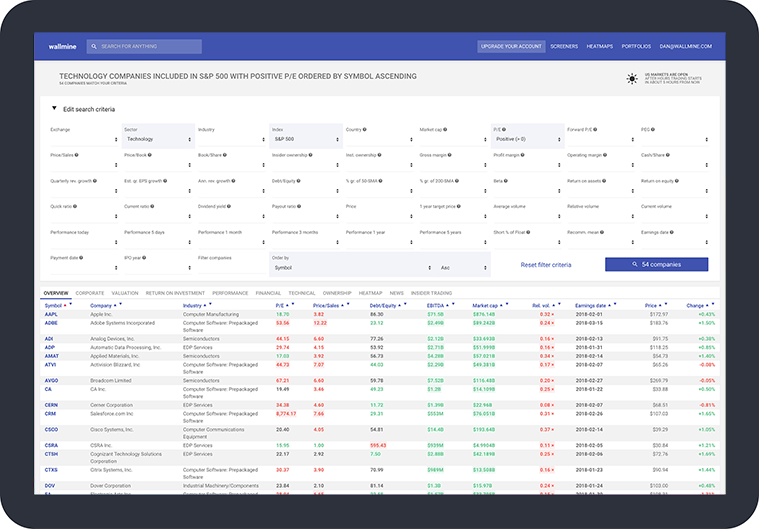
Comprehensive screeners
Screen for cryptocurrencies and stocks based on hundreds of criteria
Portfolio heat maps and visualizations
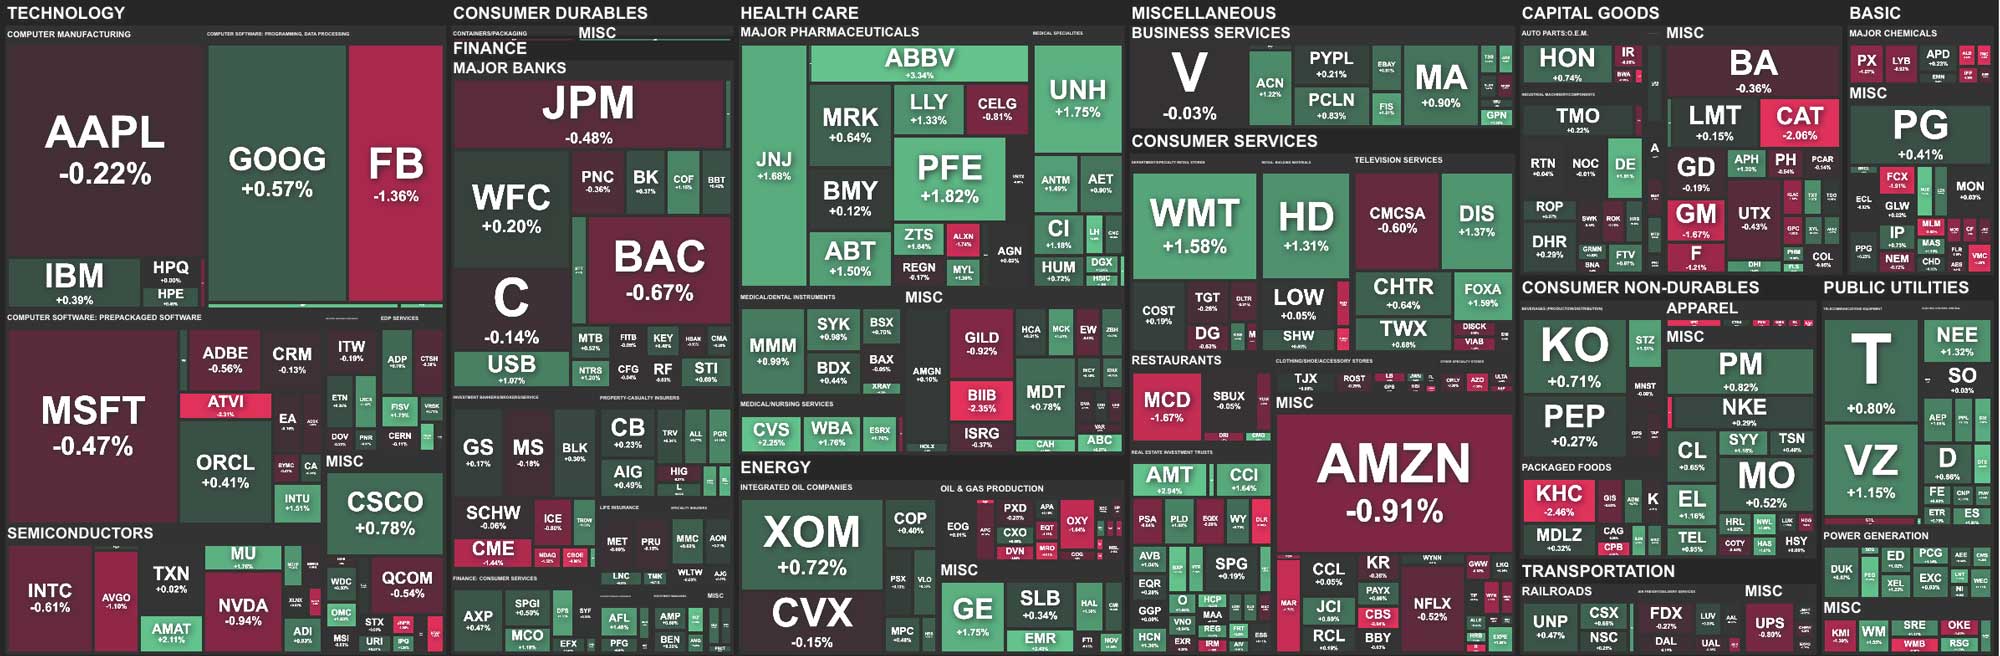
Visualize your investments
View the performance of your portfolio investments and the entire markets by zooming in and out of the map.
Spot the difference
Compare sectors, industries, and countries and visualize your portfolio diversification.
Stock screener
Use the tens of fundamental and technical criteria to find profitable stocks and cryptocurrencies. You can also use the stock screener to compare specific stocks based on the same range of metrics. Heat maps, news, insiders trading, and data insights are available for every screen, portfolio, and watchlist.
You are in good company
Wallmine is the favorite tool of many professional and retail investors.

"Wallmine contains a variety of tools including a market map, which displays a visual representation of price changes and volume, and a stock screener. It's got some interesting tools to play with."
Portfolio tracking
The primary use of portfolio trackers is to provide you with digestible information on what is happening with your investments at all times. You have the ability to compare yearly and daily returns and track the balances at any minute. Most of the time, portfolios allow you to track a combination of financial assets that include stocks, ETFs, and mutual funds. Increasingly, bonds, foreign currencies, and cryptocurrencies can also be managed in most stock tracking software. Some portfolio trackers sync with your broker accounts and pull in the trades automatically, while others require manual input. Alternatively, they allow you to upload a file previously exported from your broker that will serve as the basis for populating transactions data.
Apps that are able to track your stocks have become the most popular compared to standalone software tools. They allow you to monitor your investments anywhere and at any time. All of them also offer real-time quotes. However, while delayed quotes are free, live prices are usually subject to a fee. Performance tracking is extremely easy. The apps analyze your portfolio automatically and calculate performance metrics. As a result, you can view your returns, asset and sector allocation, predictions or recommendations at any time.
Primarily, stock tracker apps are a great way of making sure you stay updated on all events connected to the stocks in your portfolio. Portfolio alerts and recent news are two of the most effective ways to achieve that. You can set up different alerts to be notified when the price or volume in your portfolio changes by more than the trigger limit. Recent news and analyst ratings give you the ability to understand your stocks changes in the context of the whole stock market. Finally, portfolio charts and graphs show you the investment development at a glance, where you can easily compare returns over different time periods.